Brighton predictions
England · Premier League · UEFA Europa Conference League · EFL Cup
Next matches
- Hull City vs Brighton Sun, Nov 22, 2026, 02:00 PM UTC · 25% · 25% · 50%
- Brighton vs Universitatea Craiova Thu, Nov 26, 2026, 05:45 PM UTC · 78% · 14% · 8%
- Brighton vs Newcastle Sun, Nov 29, 2026, 02:05 PM UTC · 56% · 22% · 22%
- Bournemouth vs Brighton Wed, Dec 2, 2026, 08:15 PM UTC · 42% · 24% · 34%
- Nottingham Forest vs Brighton Sat, Dec 5, 2026, 05:30 PM UTC · 33% · 25% · 42%
- Brighton vs Monaco Thu, Dec 10, 2026, 08:00 PM UTC · 66% · 19% · 15%
Where they stand
| Competition | Position | Played | Points | Goal difference | Form |
|---|---|---|---|---|---|
| Premier League | 2 / 20 | 10 | 22 | +19 | WWLWW |
| UEFA Europa Conference League · UEFA Conference League | 5 / 36 | 3 | 7 | +5 | WDW |
The latest table, as of November 12, 2026.
Recent results
- Brighton 2–0 Brentford Sun, Nov 8, 2026, 02:00 PM UTC
- Getafe 0–1 Brighton Thu, Nov 5, 2026, 08:00 PM UTC
- Manchester City 0–1 Brighton Sat, Oct 31, 2026, 03:00 PM UTC
- Manchester City 2–2 Brighton Wed, Oct 28, 2026, 07:30 PM UTC
- Liverpool 2–0 Brighton Sun, Oct 25, 2026, 02:00 PM UTC
- FK Jablonec 0–0 Brighton Thu, Oct 22, 2026, 04:45 PM UTC
- Brighton 5–0 Crystal Palace Sun, Oct 18, 2026, 01:00 PM UTC
- Brighton 4–0 Kauno Žalgiris Thu, Oct 15, 2026, 07:00 PM UTC
- Sunderland 0–2 Brighton Sat, Oct 10, 2026, 02:00 PM UTC
- Brighton 3–0 Arsenal Sat, Sep 19, 2026, 02:00 PM UTC
Per match, last 10 matches
| Statistic | For | Against |
|---|---|---|
| Shots | 18.4 | 10.1 |
| Shots on target | 5.0 | 2.8 |
| Corners | 6.1 | 4.3 |
| Fouls | 12.8 | 8.6 |
| Offsides | 1.7 | 3.2 |
| Yellow cards | 2.4 | 1.1 |
| Possession (%) | 56.6 | 43.4 |
| Expected goals (xG) | 1.84 | 0.86 |
Averages over its last matches in the competitions we follow; a figure counts only the matches that reported it.
Per match, last 10 matches
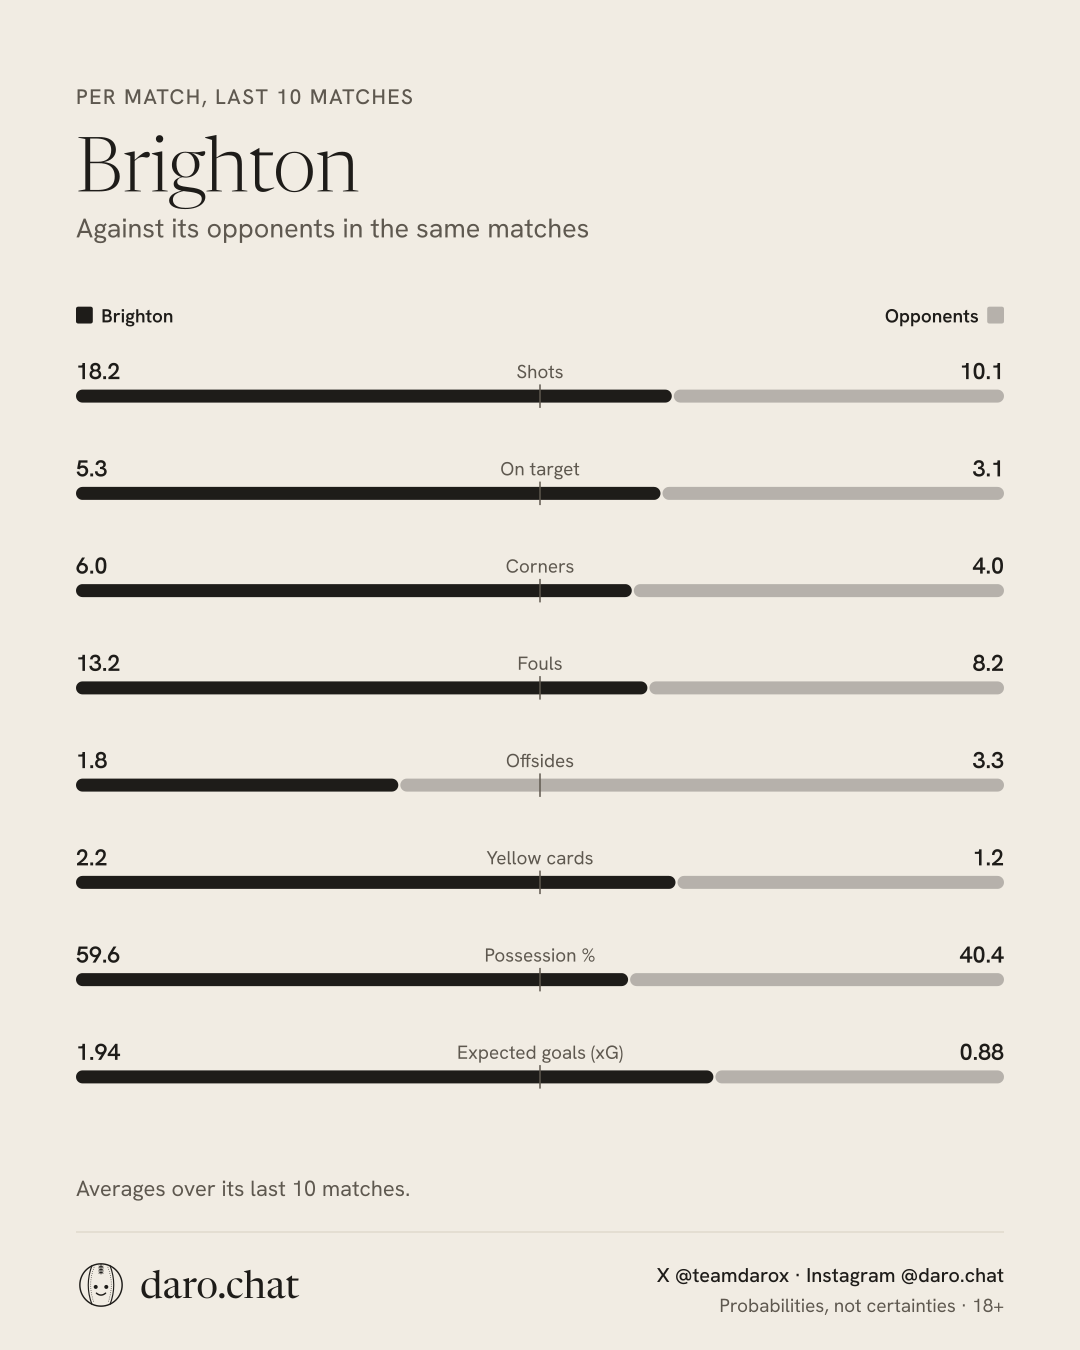
Shots: Brighton 18.4, opponents 10.1; On target: Brighton 5.0, opponents 2.8; Corners: Brighton 6.1, opponents 4.3; Fouls: Brighton 12.8, opponents 8.6; Offsides: Brighton 1.7, opponents 3.2; Yellow cards: Brighton 2.4, opponents 1.1; Possession %: Brighton 56.6, opponents 43.4; Expected goals (xG): Brighton 1.84, opponents 0.86
How it plays · Premier League 2026/27
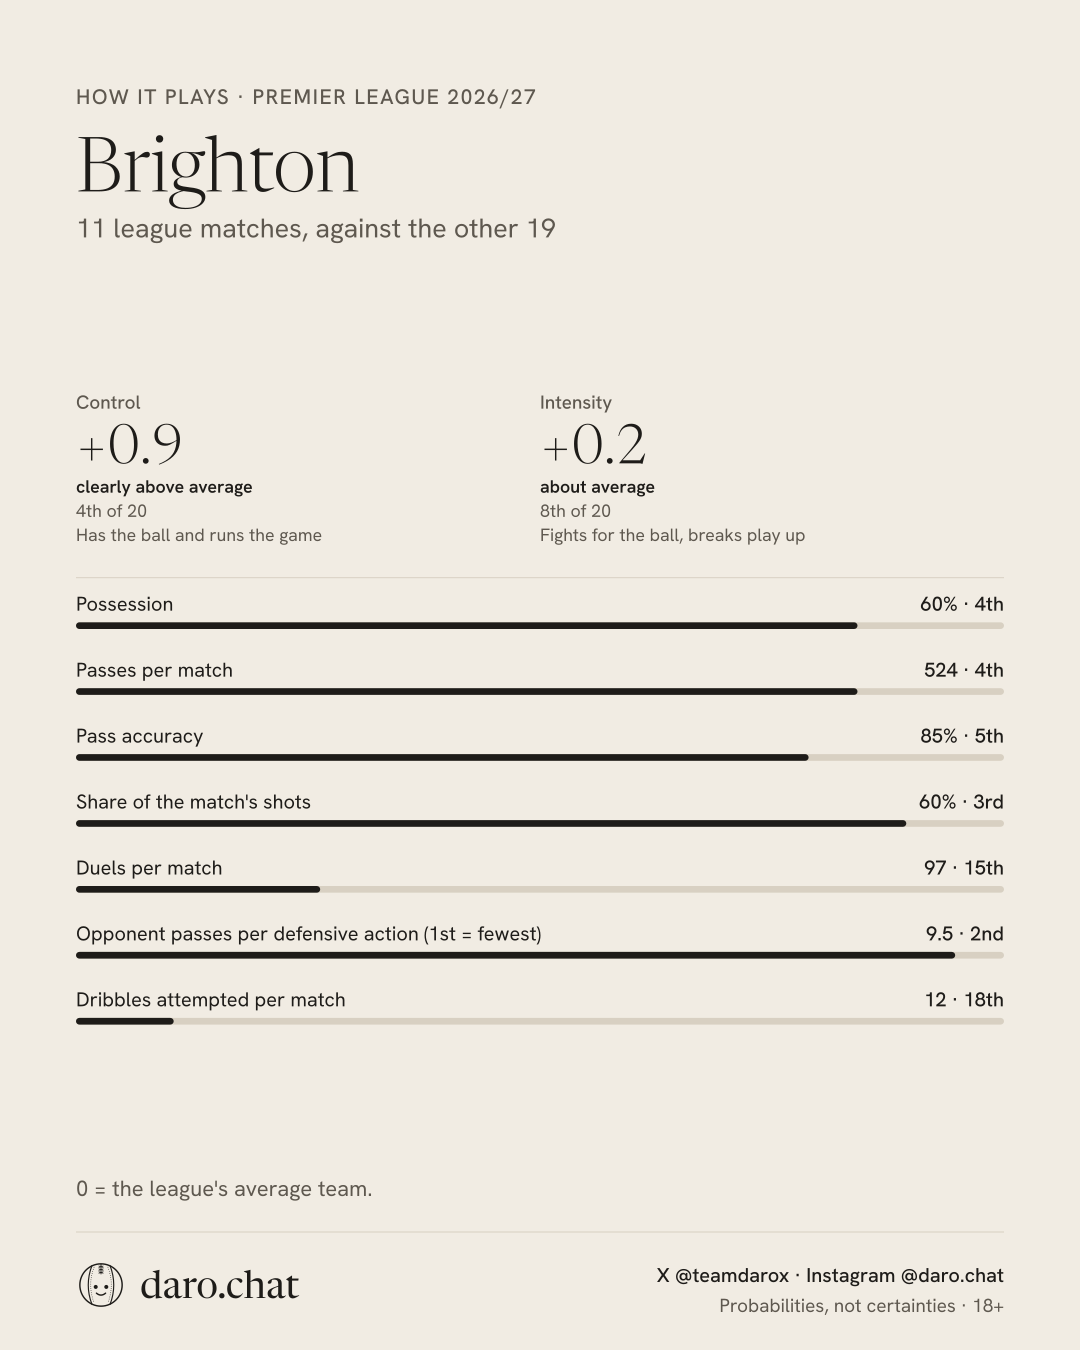
Control (has the ball and runs the game): +0.8, clearly above average, 5th of 20; Intensity (fights for the ball, breaks play up): +0.1, about average, 10th of 20; Possession: 60%, 4th of 20; Passes per match: 518, 5th of 20; Pass accuracy: 85%, 6th of 20; Share of the match's shots: 60%, 4th of 20; Duels per match: 97, 16th of 20; Opponent passes per defensive action (1st = fewest): 9.9, 2nd of 20; Dribbles attempted per match: 12, 18th of 20
How it attacks · Premier League 2026/27
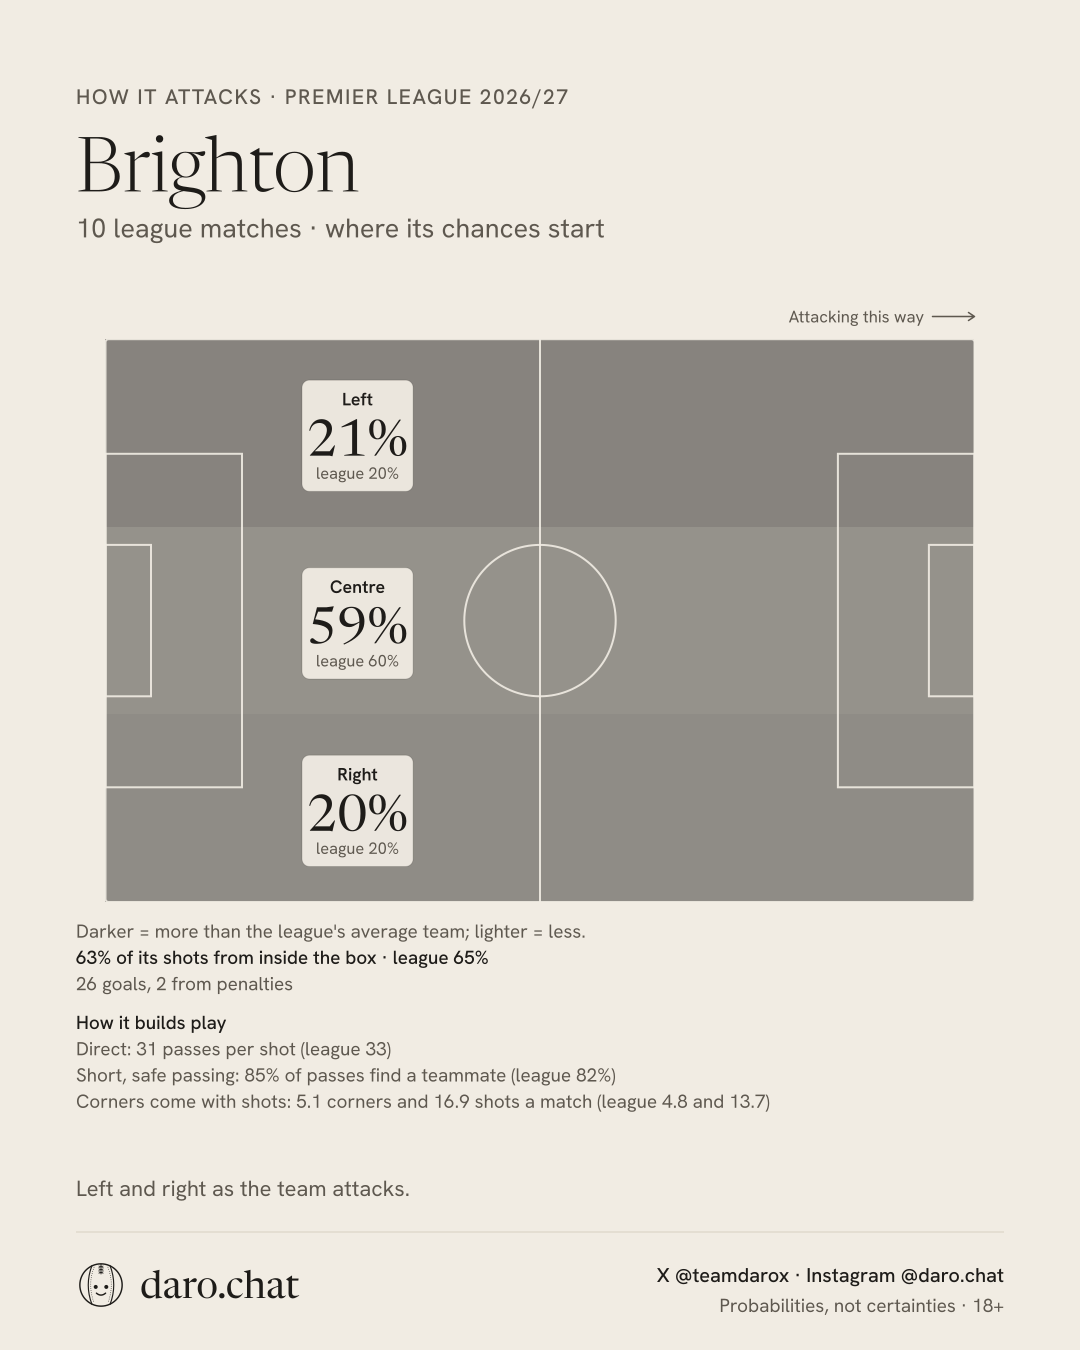
Brighton: 21% of its chances from the left, 59% through the centre, 20% from the right (league 20%, 60%, 20%). 63% of its shots from inside the box (league 65%). 26 goals, 2 from penalties. How it builds play: Direct: 31 passes per shot (league 33); Short, safe passing: 85% of passes find a teammate (league 82%); Corners come with shots: 5.1 corners and 16.9 shots a match (league 4.8 and 13.7).
How it defends · Premier League 2026/27
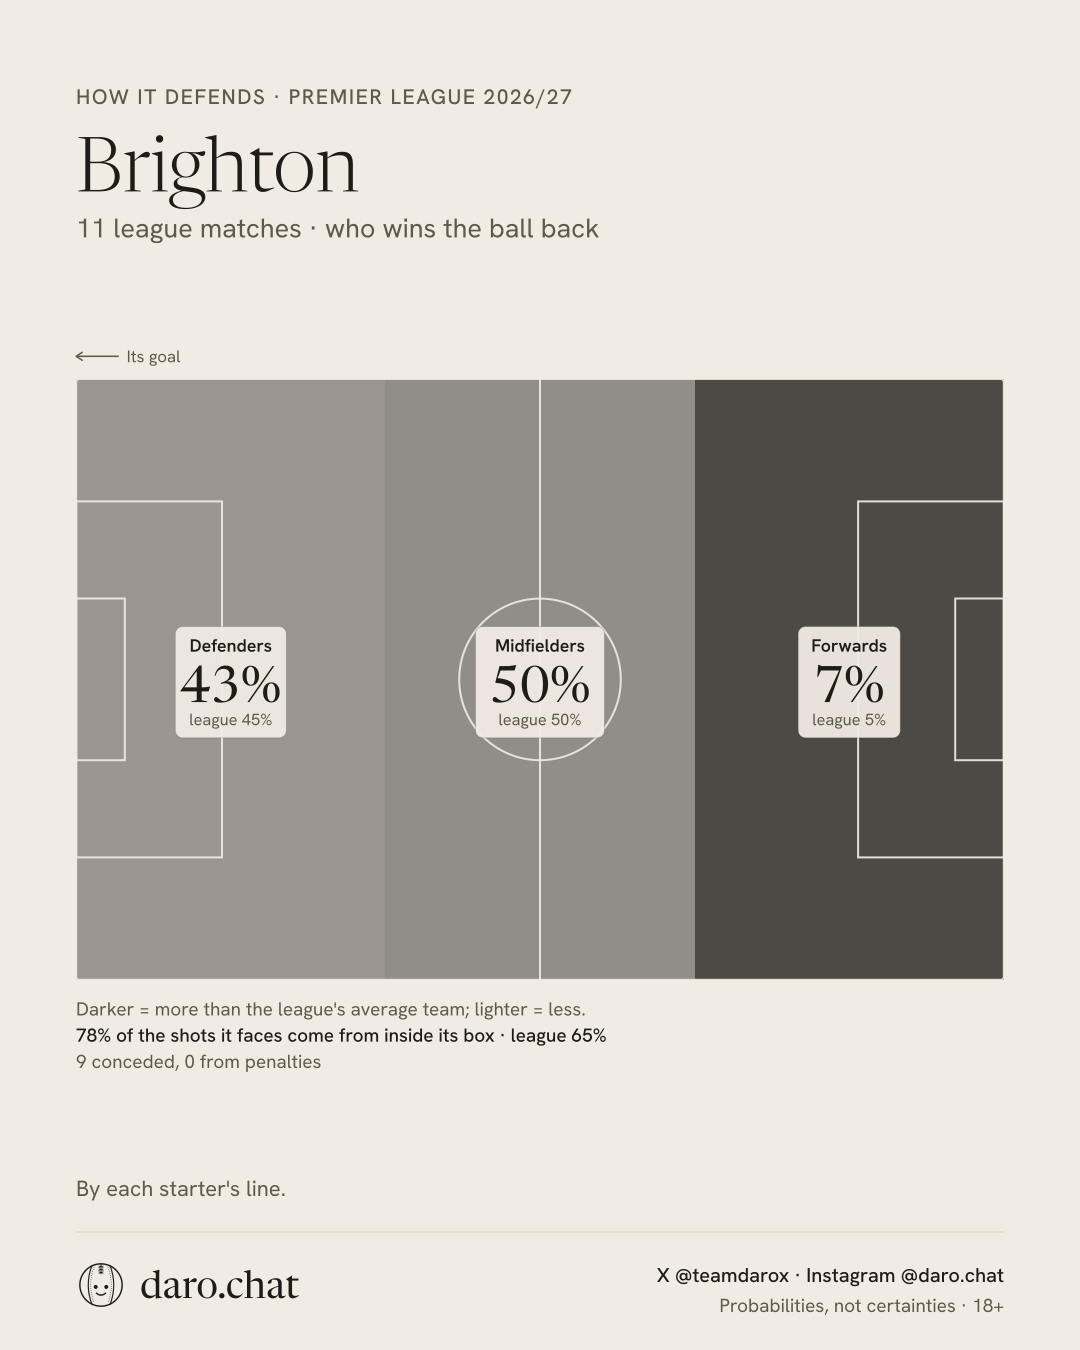
Brighton: its defenders make 42% of its tackles, interceptions and blocks, midfielders 52%, forwards 6% (league 45%, 50%, 5%). 77% of the shots it faces come from inside its box (league 65%). 7 conceded, 0 from penalties.
When it scores · when it concedes
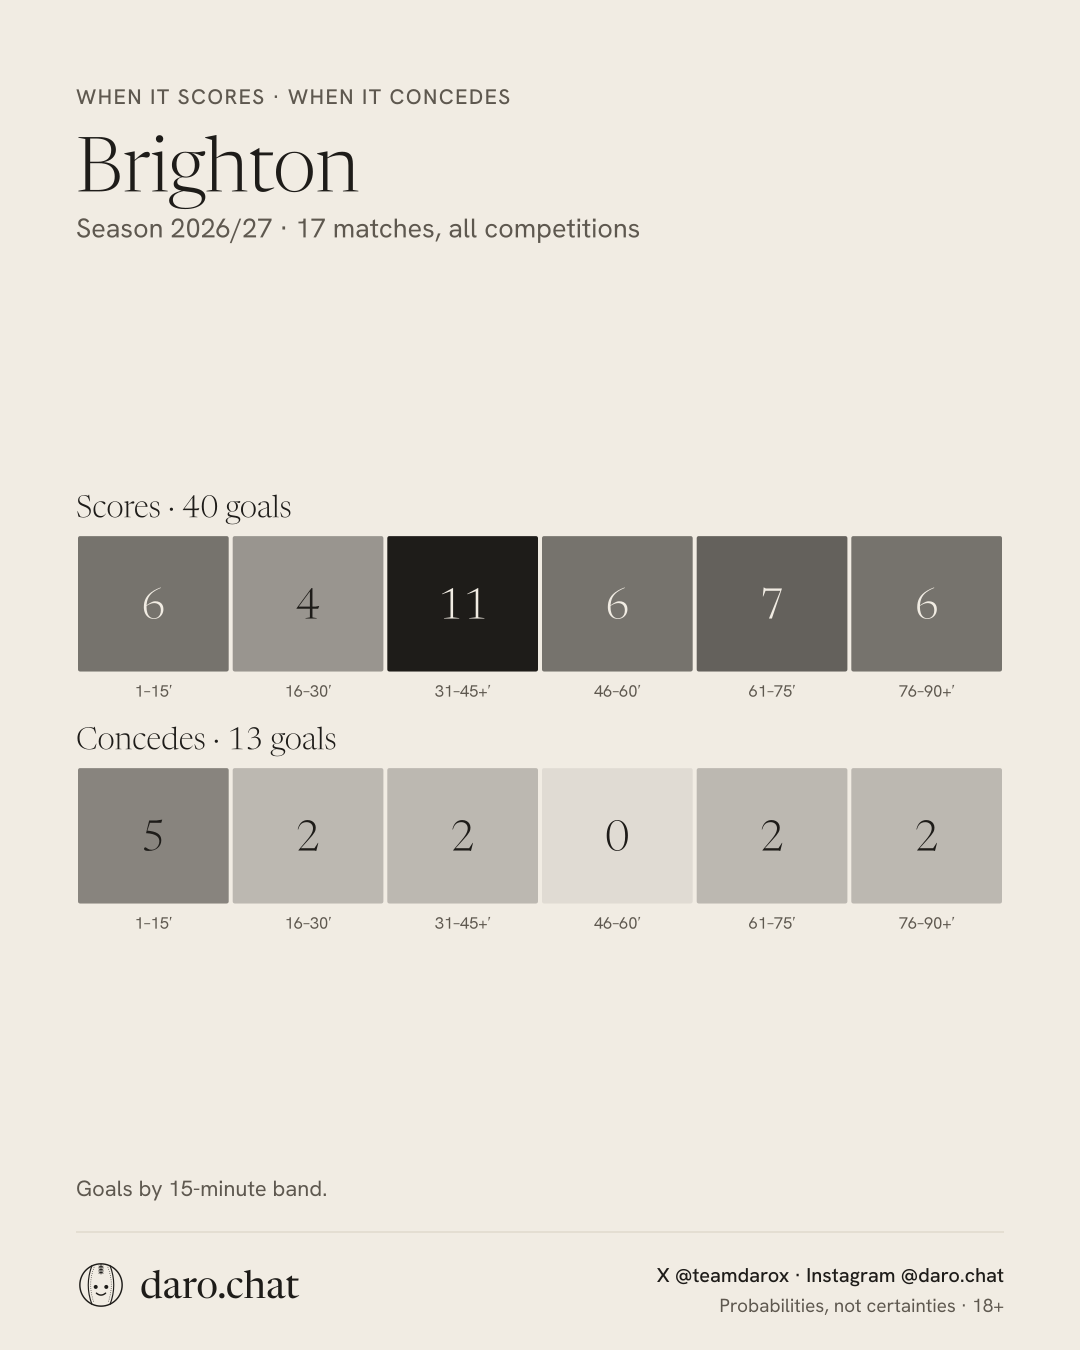
Scores 40 goals: 1–15′ 6, 16–30′ 4, 31–45+′ 11, 46–60′ 6, 61–75′ 7, 76–90+′ 6. Concedes 11 goals: 1–15′ 5, 16–30′ 2, 31–45+′ 2, 46–60′ 0, 61–75′ 2, 76–90+′ 0.